Friday 9 December 2016

Winter preparation


Today I was fortunate to be joined by Mr. Kobayashi, a prospective graduate student, and we worked in the rain to collect an invaluable discharge measurement. Cold December rain makes some of the hardest working conditions for fieldwork, so thank you very much for your help! Photos by Mr. Kobayashi.


We also worked to clean and set up the snow lysimeter experiment. This experiment has been running since 2002, so 15 years now! The most important device is the tipping bucket which measures the runoff, and this is still functioning well. Key to obtaining good data for lysimeter runoff is the cleaning and maintenance of the collection trays and drainage system. Fallen leaves or needles easily block the drainage holes, until a good cover of snow is achieved. The snow cover, once established, acts as a good filter to keep dirt away from the drains and allow accurate measurement of runoff.

Monday 21 November 2016

Moderate autumn rains


November can be a time of prolonged and quite intense rainfall, but this year there are only three moderate events in the first half of the month. The event of 8-9th November included about 40mm total precipitation with hourly intensities up to about 7mm/h.


Wednesday 2 November 2016

Autumn dry season

Stage = 0.370m, Q = 0.538m3/s

October can be very fine and dry. This year we experienced very little rain during the two weeks 10-24 October, and stage dropped to levels similar to summer minimum flows.

Again overall the match is good between the two stage recording systems, although the Hobo logger memory became full as I had not been resetting the logger since August. Resetting the logger to a 10 minute interval means that it will be able to log for 5 months until next April. This will avoid the need to remove the logger from the water column during the winter in snowy conditions. The Kadec system definitely has the advantage of more easily downloading the data, although even then it is not really possible during heavy rain or snow.


Tuesday 4 October 2016

The importance of stage measurement

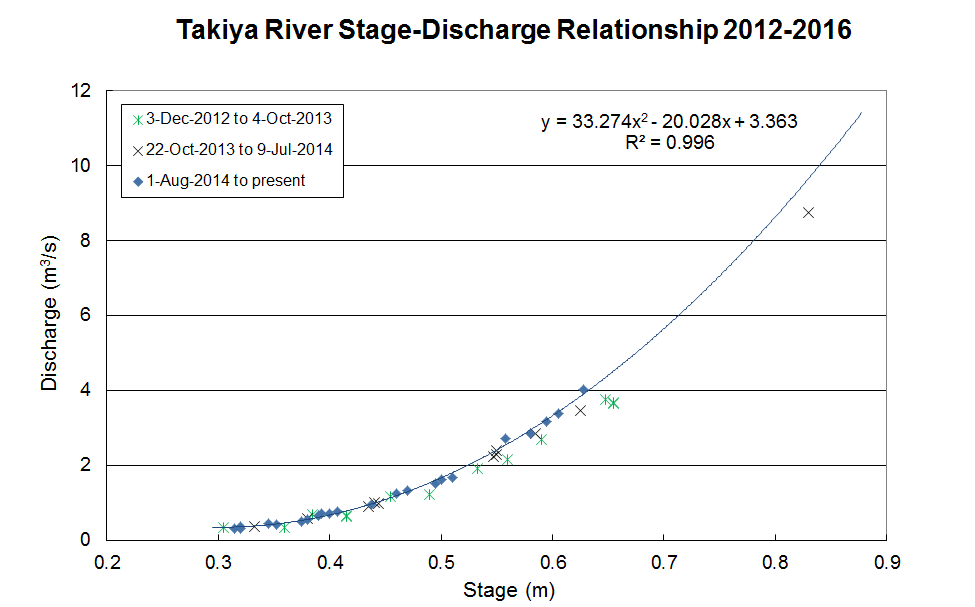
Stage = 0.378m, Q = 0.521m3/s

In monitoring river discharge, the importance of stage measurement cannot be over-stressed. Accurate and reliable stage measurement in addition to regular maintenance of a site stage-rating curve will be fundamental in obtaining continuous discharge estimation.

For 16 years I've used the same system to monitor stage (pressure transducer and Kadec data logger) with no reliability issues at all. I've just had to change the batteries once per year, and check the offset on each field visit to make sure the visual stage reading matches the data logger reading.

However, recently some issues with the offset adjustment within the data logger have led me to acquire a second back-up system to monitor stage. I chose the inexpensive and widely used Hobo loggers, and have been comparing the Kadec and Hobo loggers since the summer. The Hobo logger system is unvented and so we need to install two sensor/loggers - one to monitor pressure in the water column and another to monitor atmospheric pressure.

The other major difference between the two systems is that the Kadec logger can be easily downloaded on the river bank, while the Hobo logger must first be retrieved from the river and then re-installed after download, making careful note of stage levels during this process.


The two stage hydrographs above show that overall the agreement is good between the two logger systems. However, there are some significant differences, especially during periods of moderate to low flows, in particular the period in early September. The Kadec logger seems to show a more unsteady stage curve during lower flows, and this needs to be further investigated. Perhaps the atmospheric pressure venting or the temperature compensation is not working as effectively as it should be.

Monday 12 September 2016

Low flows and typhoons


During the month from mid-August to mid-September river stage has varied widely from low flows of 0.25 m stage to peaks of up to 1.3 m. Typhoon No.10 passed over northern Japan during August 30-31 and brought moderately heavy rain to the Takiya River basin. Total storm precipitation of 92 mm and an hourly maximum of 24 mm/h fell at Mt. Ishiguro (elevation 900 m), while low elevation gauges at Miomote and Takane (Amedas) recorded lower intensities and about 60 mm for the storm total.

Stage = 0.343m, Q = 0.380 m3/s

Very large accumulations of fine gravel have occurred at the gauging cross-section (likely due to the typhoon event), although confirmation of the stage-rating curve showed that there had not yet been a significant change. The newly installed Hobo logger was almost buried under the loose and unconsolidated gravel.


Friday 12 August 2016

Summer low flows


The end of July and the first half of August have been mostly dry, and you can see the stage following a decreasing trend interrupted by a couple of rainfall events. Conditions are hot with highs in the 30s Celsius, and so ET is high during the daytime and this shows up on the stage hydrograph as a series of dips.


Today I measured the discharge at a stage of 30cm, and then installed a new stage recorder (HOBO) attaching it to the steel pipe of the staff gauge within a housing of PVC pipe. The pressure transducer I've been using since 2000 has started to become rather erratic and I suspect it is no longer venting properly with changes in atmospheric pressure. It shows drift from the observed staff gauge reading of up to 25mm after a couple of weeks. Today it was 10mm too low before I reset the offset.


Wednesday 13 July 2016

Rainy season


The hydrograph above shows the arrival of the summer rainy season on June 19th, firstly with a series of minor rainfall events followed by a moderate flood peak on July 3rd, and a major flood event on July 6th. Total daily rainfall on July 6th was 85mm and 105mm at the local Miomote and Takane Amedas stations, where maximum intensities reached 29mm/h and 33mm/h respectively. These high intensities produce a flash-flood response, and river stage rose by as much as 30cm over 10 minutes.

Stage = 43cm, Q = 1.05m3/s, Ta = 21.0C, Tw = 16.6C

Today I was joined by two doctoral students, Mirlan from Kyrgyzstan and Tsyden from Lake Baikal region in Russia. We measured discharge and confirmed no major changes in the rating curve, though there was some evidence of scour in the river bed. The water colour is light grey due to fine sediment being supplied at the upstream landslide site.

Mirlan and Tsyden prepare to start the discharge measurement


Flattened vegetation is clear evidence of how high the flood waters reached
Cool water temperatures and warm humid air produce a river mist

Wednesday 1 June 2016

Stage-Discharge Rating Curve


Today we took another discharge measurement in similar low flow conditions and confirmed the stage-rating curve. The new measurement (0.358 m, 0.500 m3/s) plots very close to the current rating-curve estimate (0.459 m3/s). The difference between the measured and the estimated is 0.04 m3/s or 8.8% above the expected value.

Stage = 0.358 m, Q = 0.500 m3/s

Monday 23 May 2016

Early summer low flows

Stage = 35.5cm, Q = 0.47m3/s, Ta = 23C, Tw = 15C.

Today participants from JICA took part in surveying discharge at Takiya River. We used 4 different teams in different cross-sections and compared the results. Two teams produced a very similar result within 5% of the current stage-rating curve, while the other two teams were overestimating discharge by a very significant amount (30%). The most likely reasons are systematic error in setting the depth of the current meter (too high) and overestimating the flow depth.


The hydrograph above shows clearly that snowmelt diurnal fluctuations continue until late April, after which there is a period of unsettled rainy weather. May 3rd was dry but we can see evidence of a small snowmelt peak during the afternoon, indicating the end of the snowmelt season for this basin. The diurnal fluctuations after this date are due to the influence of high rates of evapotranspiration, which has the opposite effect to snowmelt in drawing water levels down during the daytime. This pattern is very clear during the last few days of data recorded.

The below-average snowpack from this past winter has melted off about 4 weeks earlier than last year, and so discharge is already down to about half the amount of last year for late May.

JICA participants visit Niigata University (Course: Irrigation and Drainage through Integrated Water Management)

Tuesday 12 April 2016

Snowmelt season

Fine weather snowmelt conditions. Stage = 50cm, Tw = 8C.

From the hydrograph below we can see that fine weather snowmelt conditions begin over the last few days of March and into April, as indicated by the daily fluctuations or sine wave pattern. This is characteristic of streamflow hydrographs in snowmelt regions. As warm sunny days continue, the daily fluctuations rise higher and higher as groundwater levels rise. On top of this we have the influence of rainfall events, most notably on 30 March (18mm) and 7 April (36mm). However, these events do not reach the high stage of over 1m that was recorded on 14 February this year due to rain-on-snow.


Larch lysimeter site after snow has completely melted
Cedar lysimeter site after snow has completely melted

Time-lapse cameras showed that the snowpack had completely melted by 27 March at the larch site, while it remained four days longer until 31 March at the cedar site.

Friday 4 March 2016

February rain-on-snow flood

Larch snow lysimeter site (depth = 63cm, density = 0.38, SWE = 24.0cm)

Today's snow survey showed that the snowpack is more or less the same as in the last survey in mid-February. Snow densities have increased from about 0.3 to nearly 0.4 at the larch site, indicating that the snowpack has ripened considerably and reached a melt condition. The snow water equivalent is up slightly to 24 cm at the larch site, whereas it dropped about 2 cm to 16 cm at the cedar site.

4 March: Stage = 51cm, Tw = 5C

Downloading the stage data and plotting the hydrograph as below, we can see a very prominent flood event on 14 February. This is a typical late-winter rain-on-snow event, but the size of this event has only been exceeded once in the last 16 years of stream gauging for the months of January and February. Daily snowfalls occurred during the first 10 days of February, followed by rising levels of sunshine and rapidly warming temperatures, with a Tmax of 11.8 degrees and over 9 hours of sunshine on 12 February. This was followed by warm, cloudy and windy weather when overnight temperatures remained above freezing. On 14 February heavy precipitation of around 10mm/h and 40mm/d fell in the upstream area and Tmax reached 12.3 degrees, producing perfect conditions for rain-on-snow melt to occur throughout the basin. No sunshine was recorded, but wind speeds reached 11.3 m/s.

Rain-on-snow flood event on 14 February (peak Q estimated to be 18.5 m3/s)


The three largest January/February rain-on-snow events over the past 16 years:

Date               Stage (m)    Q (m3/s)   Daily Precipitation (mm)
2004 Feb 23      0.994           17.0                  44
2009 Feb 14      1.278           32.0                  52
2016 Feb 14      1.042           18.5                  37

Wednesday 24 February 2016

Snowmelt time-lapse


This time-lapse video shows the spring melt-off for the snowpack at the larch lysimeter site from 27 March to 6 April 2015. The 10 day period was captured at 5 minute intervals with a time-lapse camera. On 18 March the snowpack was measured at 25.3 cm SWE (depth 65 cm). The period starts with nighttime temperatures below freezing, but mean daily temperatures rise steadily from around 6 degrees C to around 12 degrees C, and there is frequent rainfall of up to 6.5 mm/h and 32 mm/day.

Wednesday 17 February 2016

Low levels of snowpack


Snow survey in the middle of February should give us close to the maximum snow accumulation for the season, at least for the low elevations. Melt conditions become more common during the second half of February, and precipitation amounts decrease. However, current snowpack amounts remain low compared to average conditions.

The chart above shows that the snow water equivalent for the 60 m and 140 m sites is the same at about 22.5 cm. The snow density at the 60 m site is slightly higher at 0.30 for a snow depth of 74.5 cm, whereas the values for the 140 m site are 0.28 and 79.5 cm respectively. These snowpack amounts are some of the lowest recorded since 2002, with only 2007 having snowpack significantly less than the current year.

Tuesday 26 January 2016

El Nino delays winter

Stage = 39cm, Ta = 2.0C, Tw = 3.3C

Heavy snows over the last couple of days signaled the start of mid-winter conditions and seasonal snowpack at all elevations in the basin. The formation of low elevation snowpack is about a month later than an average winter, mainly due to the strong El Nino effect and unseasonably warm temperatures at the start of this winter season.

Larch forest lysimeter site - checking and cleaning drainage

Snow survey at the larch forest lysimeter site showed there to be about 67cm depth of snow, with a snow density of about 0.25 giving a snow water equivalent of 16.5cm. Typically there would be more than a metre of snow depth by the end of January, with a density of more than 0.3 for an older snowpack. The snowpack was temporarily removed around the lysimeter tray drains to clean and confirm free drainage of the trays. For the larch site and tributary cedar site free drainage was confirmed, while at the lower cedar site I found 2 of the 3 trays to be blocked. Unfortunately a blocked drain means the runoff cannot be determined accurately up to that date, but after cleaning the lysimeter should drain freely for the rest of the winter season.

Free drainage condition confirmed in one of the trays

Snow depths at the upper (100m higher elevation) tributary cedar site were similar to the larch site, while the snow depths at the lower cedar site were the least at about 46cm due to snow interception (sublimation and melt-drip loss) in the mature canopy.

The stage hydrograph below shows a moderate peak around early New Year due to heavy rain. With continued cold and snowy conditions we expect the flow to decrease steadily towards a winter low-flow condition. However, ground-melt at the base of the snowpack and minimal evaporation loss will keep the flow level higher than the summer low-flow condition.


Monday 25 January 2016

River scene time-lapse


This time-lapse video shows the period from 2-25 January 2016 during which several rainfall and snowfall events occurred. By the end of the video, the seasonal snowpack has finally accumulated, about three weeks later than average.